

Understand what your mental wellness results really mean
See your biomarkers in context with a comprehensive panel.
- CLIA-certified labs
- HIPAA compliant
- Personalized health protocol
Alcohol use disorder and the blood signals it leaves
Alcohol use disorder biomarkers are measurable signals in blood that reveal how much and how recently the body has been exposed to alcohol, and how organs are responding. They give an objective view beyond self-report, helping confirm risky use, estimate recency and intensity, gauge liver strain, and track recovery. Some markers are direct fingerprints of alcohol itself, formed when alcohol attaches to fats in red blood cell membranes (phosphatidylethanol, PEth). Others are by-products of alcohol processing detectable for shorter windows (ethyl glucuronide, EtG; ethyl sulfate, EtS). A second group reflects the body’s response to sustained drinking, such as changes in a liver transport protein (carbohydrate-deficient transferrin, CDT), rises in liver enzymes (gamma-glutamyltransferase, GGT; aspartate aminotransferase, AST; alanine aminotransferase, ALT), and enlarged red blood cells (mean corpuscular volume, MCV). Together, these tests translate drinking behavior into biology, supporting diagnosis, assessing harm, tailoring treatment, and monitoring abstinence or relapse over time.
Why GGT, AST/ALT, and MCV matter together
Alcohol use disorder leaves fingerprints in blood: enzymes released from stressed liver cells, and changes in red blood cell size from bone marrow and nutrient effects. Together, these biomarkers reveal how alcohol is influencing liver metabolism, inflammation, blood formation, and, by extension, energy, cognition, and metabolic balance. Typical reference ranges: GGT roughly 10–40, AST about 10–40, ALT about 7–56, and MCV about 80–100. In general, GGT and AST/ALT are healthiest toward the low–middle of normal, while MCV sits most stably near the midpoint. Values within range suggest intact hepatocyte membranes, limited enzyme induction, and red cells of normal size—usually meaning minimal ongoing alcohol impact. Marked elevations tell a different story: GGT rises with hepatic enzyme induction from alcohol; AST and ALT increase with cell injury, and an AST higher than ALT, often approaching a two-to-one pattern, is classic for alcohol-related liver injury. MCV drifting above 100 reflects macrocytosis from direct marrow toxicity and folate deficiency, often before anemia appears, with fatigue, reduced exercise tolerance, glossitis, or neuropathy. Women can show enzyme and MCV changes at lower intake than men, and pregnancy typically lowers GGT while iron shifts may pull MCV down. When values are low, they usually indicate minimal enzyme induction; notably low MCV suggests iron deficiency or thalassemia rather than alcohol effects, more common in menstruating teens and women. Big picture: Tracking GGT, AST/ALT, and MCV links alcohol exposure to liver, marrow, and metabolic systems and forecasts risks such as cirrhosis, pancreatitis, cardiomyopathy, arrhythmias, cognitive decline, and certain cancers. Trends alongside bilirubin, INR, platelets, ferritin, triglycerides, and CDT sharpen the view of whole-body impact and long-term health trajectory.
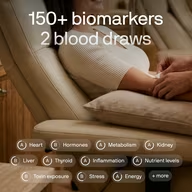
Test 150+ biomarkers
Two blood draws. A full picture of your health, explained in plain language.
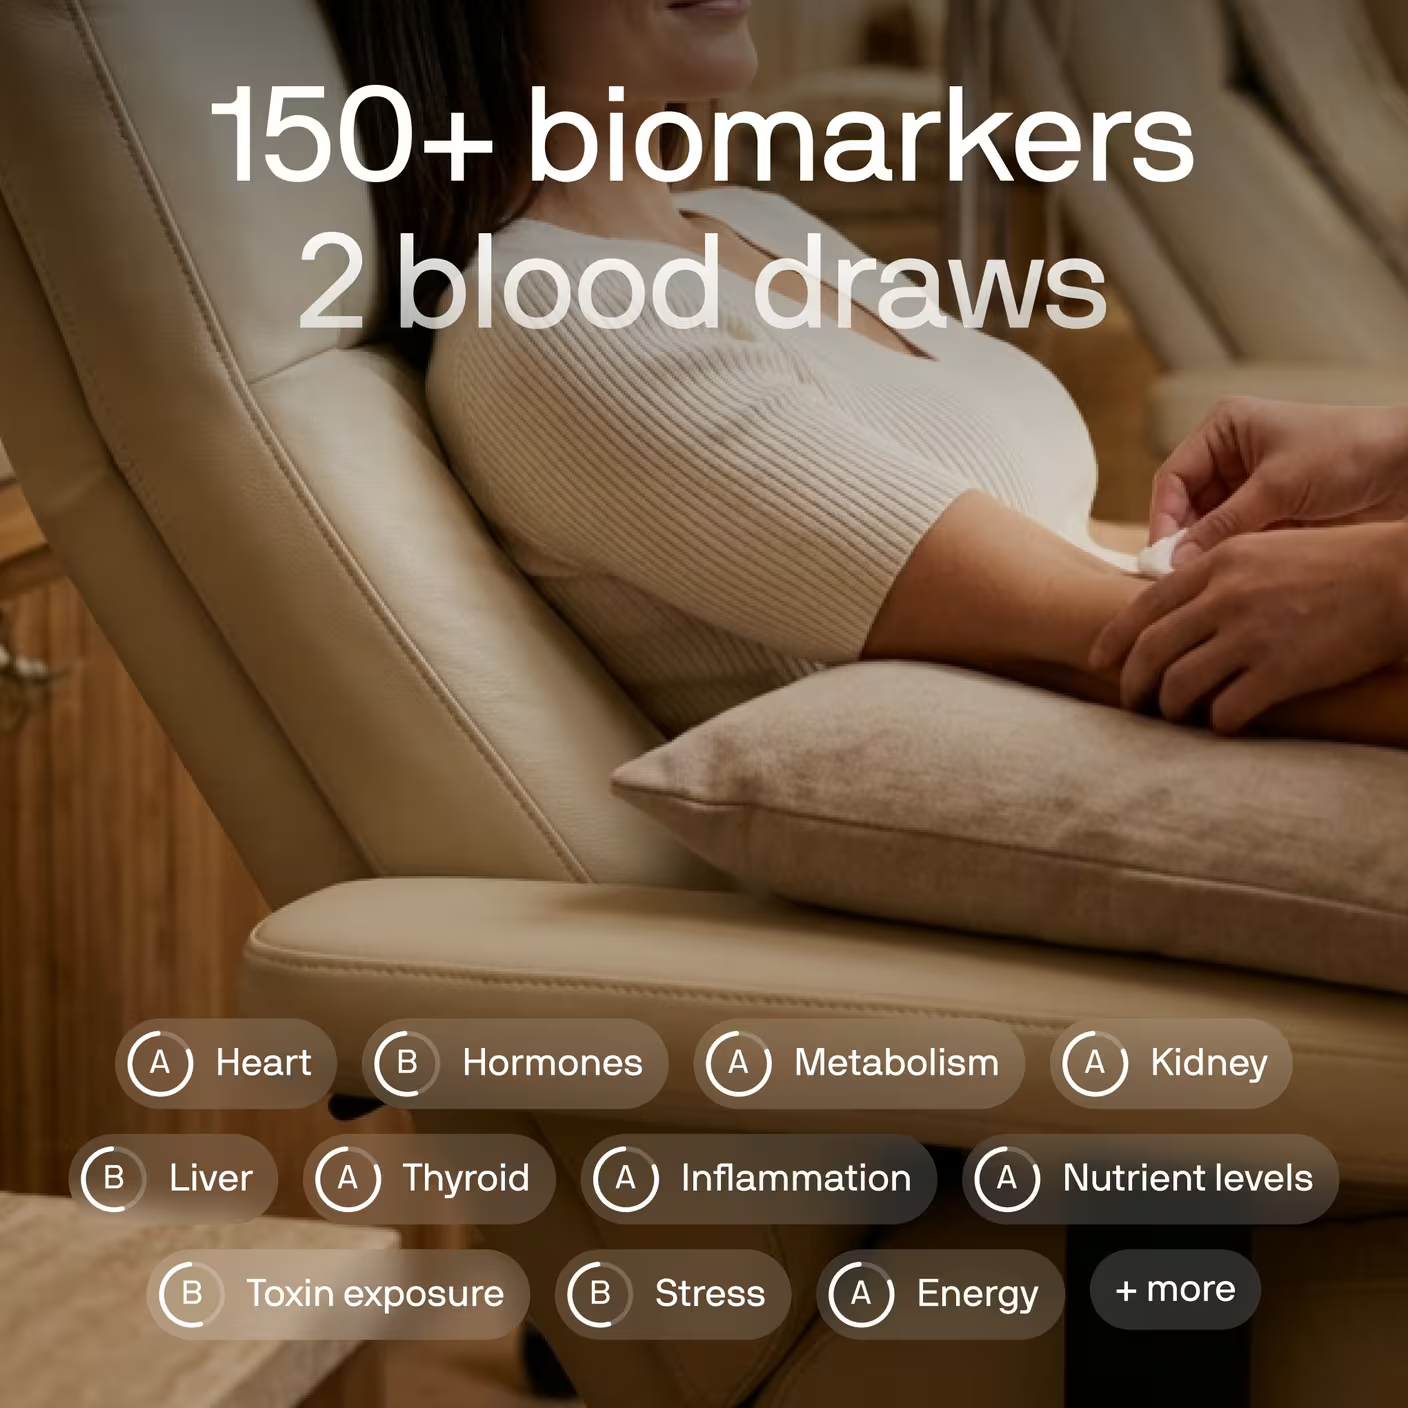
Test 150+ biomarkers
Two blood draws. A full picture of your health, explained in plain language.
What an AUD blood panel shows about drinking and the body
Alcohol use disorder (AUD) blood testing provides a window into how chronic alcohol exposure affects your body’s core systems, including liver function, blood cell health, and overall metabolic stability. At Superpower, we focus on three key biomarkers: gamma-glutamyl transferase (GGT), aspartate aminotransferase/alanine aminotransferase (AST/ALT), and mean corpuscular volume (MCV). Together, these markers help reveal the impact of alcohol on your liver, blood, and broader physiological balance. GGT is an enzyme found in liver cells and is often elevated when the liver is under stress from alcohol. AST and ALT are enzymes that help process amino acids; when liver cells are damaged, these enzymes leak into the bloodstream, signaling liver injury. MCV measures the average size of your red blood cells, which can increase with chronic alcohol use due to its effects on bone marrow and nutrient absorption. When these biomarkers are within normal ranges, it suggests that your liver is processing toxins efficiently, your blood cells are healthy, and your metabolic systems are stable. Elevated GGT or AST/ALT may indicate liver stress or injury, while a high MCV can point to changes in blood cell production linked to alcohol’s effects on the body. Persistent abnormalities in these markers can signal ongoing physiological strain and reduced system resilience. Interpretation of these results depends on several factors, including age, sex, underlying health conditions, medications, and even recent illness. Laboratory methods and reference ranges can also vary, so results are best understood in the context of your overall health profile.
Frequently Asked Questions
References
- Tavakoli HR, Hull M, Okasinski M (2011). Review of current clinical biomarkers for the detection of alcohol dependence. *Innovations in Clinical Neuroscience*, *8*(3), 26-33. https://pubmed.ncbi.nlm.nih.gov/21487543/
- Stewart SH, Koch DG, Willner IR, Anton RF, Reuben A (2014). Validation of blood phosphatidylethanol as an alcohol consumption biomarker in patients with chronic liver disease. *Alcoholism: Clinical and Experimental Research*, *38*(6), 1706-1711. https://doi.org/10.1111/acer.12442
- Niemela O, Parkkila S (2004). Alcoholic macrocytosis: Is there a role for acetaldehyde and adducts? *Addiction Biology*, *9*(1), 3-10. https://doi.org/10.1080/13556210410001674031
- Majhi S, Baral N, Lamsal M, Mehta KD (2006). De Ritis ratio as diagnostic marker of alcoholic liver disease. *Nepal Medical College Journal*, *8*(1), 40-42. https://pubmed.ncbi.nlm.nih.gov/16827089/
- Higgins-Biddle JC, Babor TF (2018). A review of the Alcohol Use Disorders Identification Test (AUDIT), AUDIT-C, and USAUDIT for screening in the United States: Past issues and future directions. *The American Journal of Drug and Alcohol Abuse*, *44*(6), 578-586. https://doi.org/10.1080/00952990.2018.1456545






















 Heart & Vascular Health
 Metabolic Health
 Energy
 Liver Health
 Kidney
 Sex Hormones
 Thyroid Health
 Nutrients
 Immune System
 Inflammation