


Understand what your keto low carb results really mean
See your biomarkers in context with a comprehensive panel.
- CLIA-certified labs
- HIPAA compliant
- Personalized health protocol
One teaspoon of granulated sugar weighs about 4 grams and contains 4 grams of carbs, because sugar is pure carbohydrate; one tablespoon contains roughly 12 grams. If you’re tracking macros for a ketogenic diet or managing insulin resistance, these measurements become the foundation of your daily carb budget.
What sugar actually is at the molecular level
Sugar is a carbohydrate. That’s not a simplification or approximation. It’s the chemical reality. Sugar alcohols and fiber count differently: both sit under total carbohydrate on a label, but many low-carb trackers subtract them to get net carbs, as the guide on whether fiber cancels out carbs explains. Whether you’re looking at table sugar, honey, or the lactose in milk, you’re looking at molecules made of carbon, hydrogen, and oxygen arranged in specific patterns that your body recognizes as fuel.
The most common dietary sugars fall into two categories: monosaccharides and disaccharides. Monosaccharides are single-sugar molecules like glucose, fructose, and galactose. Disaccharides are two monosaccharides bonded together. Sucrose (table sugar) is glucose plus fructose. Lactose (milk sugar) is glucose plus galactose. Maltose is two glucose molecules linked.
When you eat any of these sugars, your digestive system breaks the bonds and absorbs the individual monosaccharides into your bloodstream. From that point forward, your body doesn’t distinguish between the fructose that came from an apple and the fructose that came from a soda. The source doesn’t change the molecule.
Carb counts per spoonful differ by sweetener, because each weighs a different amount and some contain water. Figures below come from USDA FoodData Central (SR Legacy); tablespoon values for granulated sugar, brown sugar, and agave, and teaspoon values for honey and maple syrup, are converted at three teaspoons per tablespoon.
| Sweetener | Carbs per teaspoon (g) | Carbs per tablespoon (g) |
|---|---|---|
| Granulated sugar | 4.2 | 12.6 |
| Brown sugar, packed | 4.5 | 13.5 |
| Powdered sugar | 2.5 | 8 |
| Honey | 5.8 | 17.3 |
| Maple syrup | 4.5 | 13.4 |
| Agave syrup | 5.3 | 15.8 |
The guide to honey sugar content covers how honey compares to table sugar in more detail.
How sugar affects blood glucose, insulin, and ketone production
To enter and maintain ketosis, most people need to keep total carbohydrate intake below 50 grams per day, and often closer to 20 to 30 grams. A single tablespoon of granulated sugar, at about 12 grams, takes more than half of a 20-gram day.
When sugar enters your bloodstream as glucose, your pancreas releases insulin. Insulin’s job is to shuttle glucose into cells where it can be used for energy or stored as glycogen in your liver and muscles. The more glucose that arrives at once, the more insulin your pancreas has to produce.
Fructose takes a different route. It bypasses the initial insulin response and heads straight to your liver, where it’s converted into glucose or fat depending on your metabolic state and how much you’ve consumed. This is why high-fructose corn syrup and table sugar (which is 50% fructose) can contribute to fatty liver and insulin resistance when consumed in excess, even though fructose doesn’t spike blood glucose as sharply as pure glucose does.
Ketosis and insulin’s suppressive effect
Ketosis is a metabolic state in which your liver produces ketone bodies from fat because glucose availability is low. When you consume sugar, you’re adding pure, rapidly absorbed carbohydrate to your daily carb total.
Insulin also suppresses ketone production. When insulin levels are elevated in response to dietary carbohydrate, your liver stops making ketones and shifts back to glucose metabolism. This is why a single high-carb meal can knock you out of ketosis for days. In one small study, a breakfast with 72 grams of carbohydrate pushed people out of stable ketosis for 2 to 5 days, and longer in those with high fasting insulin.
Metabolic rate and energy partitioning
Sugar provides quick energy, but it doesn’t sustain metabolic rate the way protein and fat do. When you rely heavily on sugar for fuel, your body becomes efficient at burning glucose and less efficient at accessing stored fat. This metabolic flexibility matters for long-term weight management and energy stability.
Hormonal regulation beyond insulin
Sugar intake affects leptin and ghrelin, the hormones that regulate hunger and satiety. High sugar consumption can blunt leptin signaling, making it harder for your brain to recognize when you’ve had enough to eat. It also triggers dopamine release, which reinforces the desire to consume more sugar.
What drives sugar’s impact on your metabolism
The speed at which sugar raises blood glucose depends on the form it’s in and what else you’re eating with it. Liquid sugar, like the kind in soda or juice, hits your bloodstream faster than sugar in solid food because there’s no fiber or fat to slow digestion. A tablespoon of honey will spike your glucose more quickly than the same amount of sugar eaten with a handful of almonds.
Fiber’s protective effect
When you eat an apple, you’re consuming fructose, but you’re also consuming pectin and other fibers that slow the absorption of that sugar. The result is a more gradual rise in blood glucose and a smaller insulin response. When you drink apple juice, you’ve removed the fiber and concentrated the sugar, so the metabolic impact is closer to drinking soda.
Protein, fat, and timing
A meal that combines carbohydrate with adequate protein and fat will produce a lower and slower glucose spike than eating the carbohydrate alone. This is why a no carb approach often pairs small amounts of carbohydrate with higher-fat foods to minimize insulin surges.
Your activity level matters too. Muscle contraction during exercise increases glucose uptake into cells without requiring as much insulin. If you consume sugar around a workout, your muscles can use that glucose for fuel and glycogen replenishment, reducing the amount that gets stored as fat or triggers a prolonged insulin response.
Why the same amount of sugar affects people differently
Insulin sensitivity is the single biggest factor determining how your body responds to sugar. If your cells are highly sensitive to insulin, a small amount of the hormone can clear glucose from your bloodstream efficiently. If you’re insulin resistant, your pancreas has to produce more insulin to achieve the same effect, and your blood glucose stays elevated longer.
Insulin resistance develops over time in response to chronic overconsumption of carbohydrate, particularly refined sugars and starches. It’s also influenced by genetics, body composition, sleep quality, stress, and physical activity. Two people can eat the same 20 grams of sugar and have completely different glucose and insulin responses based on their metabolic health.
Muscle mass and glucose disposal
Skeletal muscle is the primary site of glucose disposal after a meal. The more muscle you have, the more capacity you have to store glucose as glycogen rather than letting it circulate in your bloodstream or get converted to fat. This is one reason why strength training improves metabolic flexibility and glucose tolerance.
Gut microbiome influence
Your gut microbiome affects how you metabolize sugar. Certain bacterial populations can influence glucose absorption, insulin sensitivity, and even cravings for sweet foods. Dysbiosis, an imbalance in gut bacteria, has been linked to worse glucose control and increased risk of metabolic syndrome.
Metabolic adaptation from dieting history
If you’ve spent years cycling through low-calorie diets or yo-yo weight loss, your metabolism may have adapted by becoming more efficient at storing energy and less responsive to insulin. This metabolic adaptation can make it harder to tolerate even moderate amounts of sugar without gaining weight or experiencing blood glucose swings.
Test 100+ biomarkers
One blood draw. A full picture of your health, explained in plain language.
Test 100+ biomarkers
One blood draw. A full picture of your health, explained in plain language.
Tracking sugar intake in the context of total carbohydrate load
Food labels list “Total Sugars” under the carbohydrate section, and as of recent FDA guidelines, they also list “Added Sugars” separately. This distinction helps you identify how much sugar was naturally present in the food versus how much was added during processing. But from a metabolic standpoint, both count toward your total carbohydrate intake.
If you’re following a ketogenic diet, your primary concern is staying under your daily carb limit. Whether those carbs come from the lactose in yogurt or the sucrose in a cookie, they all affect your blood glucose and insulin levels. The advantage of natural sugars in whole foods is that they typically come with fiber, vitamins, and minerals that slow absorption and provide nutritional value beyond just calories.
Tracking trends over time is more useful than obsessing over a single meal. If your fasting glucose is creeping up, or if you’re noticing that you’re getting knocked out of ketosis more easily, it’s worth looking at your average daily sugar intake over the past week or two. Small, consistent amounts of hidden sugar in condiments, sauces, and packaged foods can add up without you realizing it.
Biomarkers like hemoglobin A1c, fasting insulin, and the triglyceride-glucose index give you a more complete picture of how sugar is affecting your metabolism over weeks and months. A single glucose reading tells you what’s happening right now. A1c tells you what’s been happening for the past three months.
Turning sugar awareness into a strategy that works
How much sugar fits depends on your metabolism. For some people, that’s zero added sugar; for others, it’s 10 to 15 grams a day from whole foods, timed around exercise. A continuous glucose monitor or fingerstick checks after meals show whether a serving of berries keeps you in range. High sugar intake also tends to raise triglycerides and lower HDL cholesterol, both cardiovascular risk factors, so track them alongside hs-CRP.
How Superpower helps you track sugar and carbs
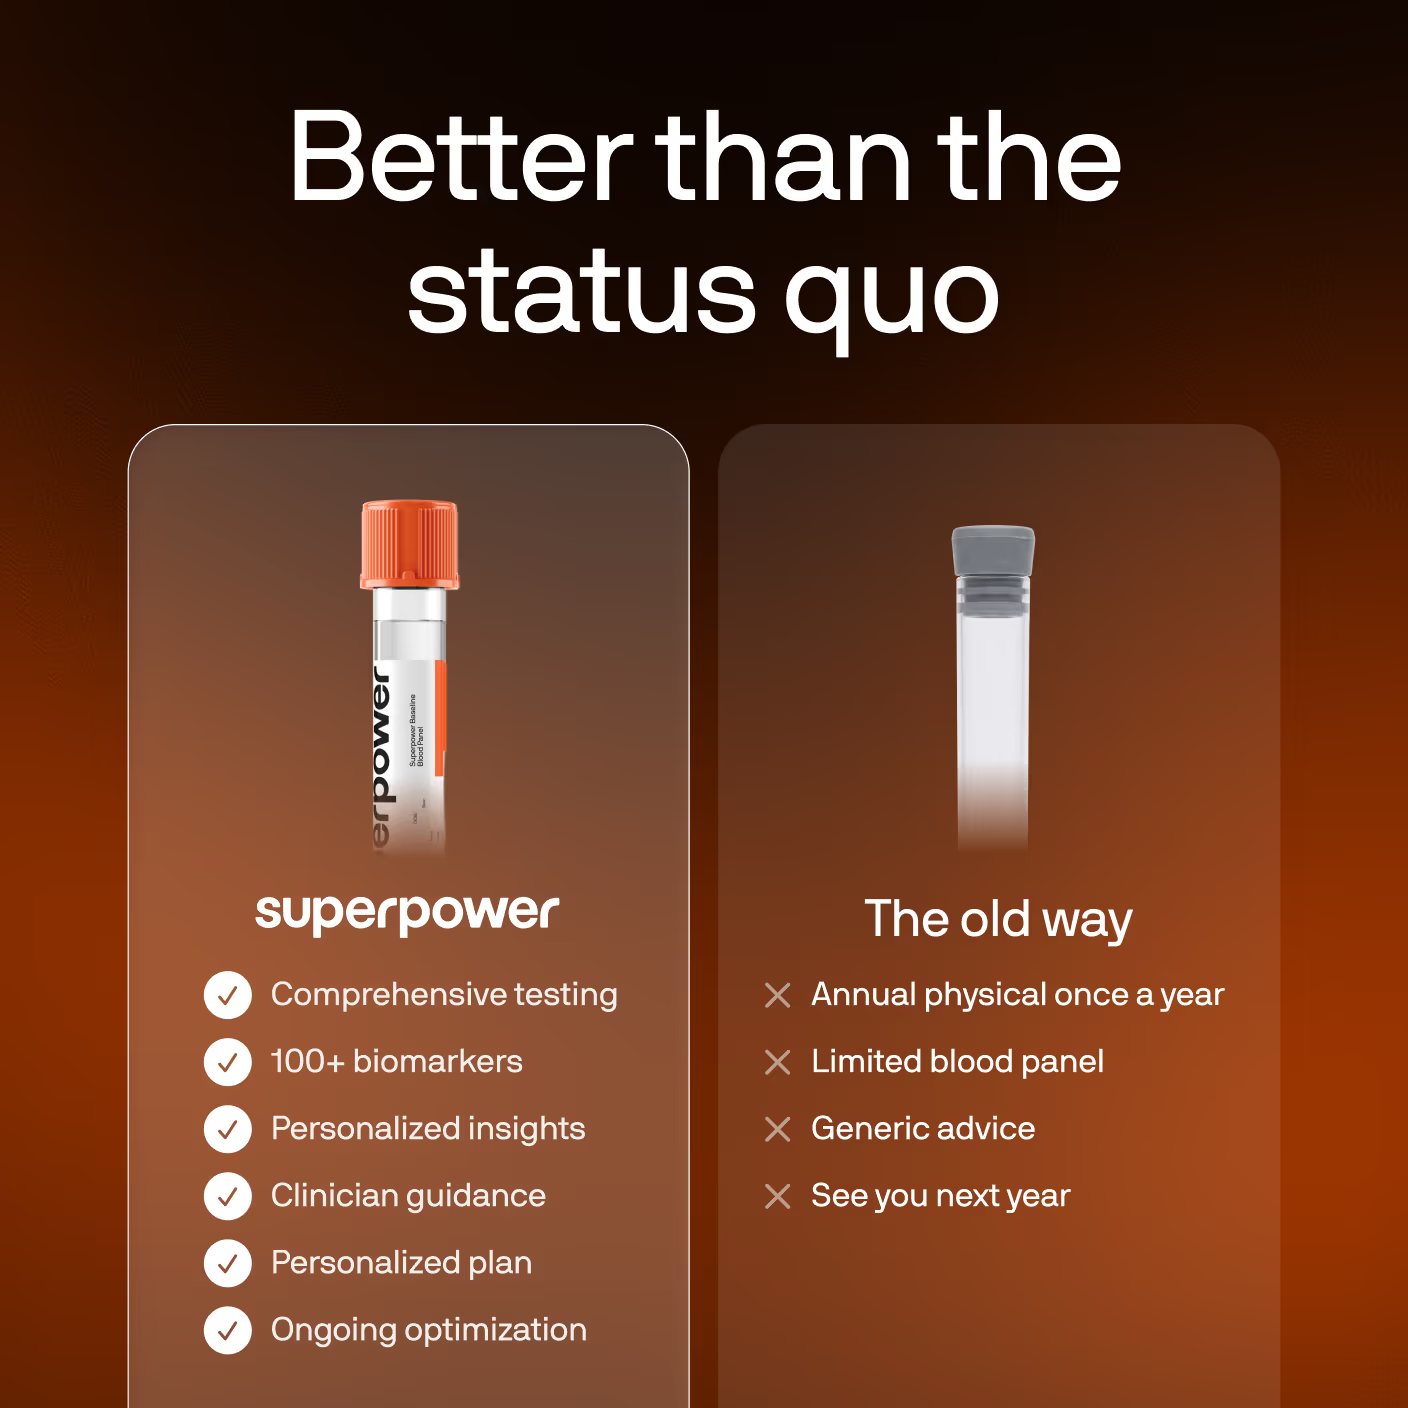
Superpower’s 100+ biomarker panel tracks fasting glucose, A1c, and lipid markers over time, so you can see whether your carb and sugar intake is working or needs adjusting.
Frequently Asked Questions
References
- Softic S, Stanhope KL, Boucher J, Divanovic S, Lanaspa MA, Johnson RJ, Kahn CR (2020). Fructose and hepatic insulin resistance. *Critical reviews in clinical laboratory sciences*, *57*(5), 308-322. https://doi.org/10.1080/10408363.2019.1711360
- Imamura F, O'Connor L, Ye Z, Mursu J, Hayashino Y, Bhupathiraju SN, Forouhi NG (2015). Consumption of sugar sweetened beverages, artificially sweetened beverages, and fruit juice and incidence of type 2 diabetes: Systematic review, meta-analysis, and estimation of population attributable fraction. *BMJ*, *351*, h3576. https://doi.org/10.1136/bmj.h3576
- Te Morenga LA, Howatson AJ, Jones RM, Mann J (2014). Dietary sugars and cardiometabolic risk: Systematic review and meta-analyses of randomized controlled trials of the effects on blood pressure and lipids. *American Journal of Clinical Nutrition*, *100*(1), 65-79. https://doi.org/10.3945/ajcn.113.081521
- Reynolds A, Mann J, Cummings J, Winter N, Mete E, Te Morenga L (2019). Carbohydrate quality and human health: A series of systematic reviews and meta-analyses. *Lancet*, *393*(10170), 434-445. https://doi.org/10.1016/S0140-6736(18)31809-9
- U.S. Department of Agriculture, Agricultural Research Service (2019). FoodData Central: SR Legacy (Sugars, granulated; Sugars, brown; Sugars, powdered; Honey; Syrups, maple; Sweetener, syrup, agave). https://fdc.nal.usda.gov/
- Paoli A, Rubini A, Volek JS, Grimaldi KA (2013). Beyond weight loss: A review of the therapeutic uses of very-low-carbohydrate (ketogenic) diets. *European Journal of Clinical Nutrition*, *67*(8), 789-796. https://doi.org/10.1038/ejcn.2013.116
- Kempf K, Martin S (2024). Effects of a Carbohydrate Meal on Lipolysis. *Nutrients*, *16*(20), 3531. https://doi.org/10.3390/nu16203531



























 Heart & Vascular Health
 Metabolic Health
 Energy
 Liver Health
 Kidney
 Sex Hormones
 Thyroid Health
 Nutrients
 Immune System
 Inflammation