


See where your results sit within their range
100+ biomarkers, glucose and hemoglobin A1c among them, in a single draw
- CLIA-certified labs
- HIPAA compliant
- Personalized health protocol
What is a reference range on a blood test?
A reference range, also called a reference interval or normal range, is the span a lab expects healthy people's results to fall within. The limits are based on results from large groups of healthy people. A result near the top of the range still reads as normal, yet it can deserve a closer look.
Some results carry no numeric reference range at all. "Negative" or "not detected" means the substance was not found, and "positive" means it was. Numeric limits come from testing healthy volunteers in a set way.
How labs calculate a reference range
Labs set a reference range by testing healthy people and keeping the central 95% of their values, in four steps.
- Choose a reference group: test at least 120 healthy people, grouped by age, sex, and testing method.
- Remove outliers: drop results far from the rest of the group.
- Cut both tails: exclude the lowest and highest 2.5% of results.
- Verify on site: check a published range against the lab's own equipment.
By design, about 5% of healthy people fall outside any one range. Across 10 tests, the odds that every result stays inside drop to about 60%. Labs either set these limits themselves or check published ones on their own equipment.
Why reference ranges differ from lab to lab
Reference ranges differ from lab to lab because each lab uses its own analyzers, reagents, methods, and reference group. Given the same patient profile, laboratories reported a variety of reference intervals for the same test.
Read each result against the range on its own report. To track a marker over time, stay with one lab, since results from different labs are not directly comparable. In a study of 48 common markers, a person's own range was narrower than the population range for most of them. Your body and the day of the draw can shift the number too.
Factors that shift your result and your reference range
Two kinds of factors move a lab result: traits that change which range applies, and conditions on the day of the draw.
- Age and sex: results for healthy people vary by age and sex, so some markers carry separate ranges.
- Pregnancy: blood dilution lowers hemoglobin, hematocrit, and albumin.
- Fasting: a fast under 8 hours was linked to glucose about 10.8% higher and triglycerides about 20.1% higher than after a fast of more than 12 hours.
- Time of day: blood cell counts follow a daily (circadian) rhythm.
- Recent hard exercise: strenuous activity can push markers outside conventional reference ranges.
Any of these can tip a result past its limits and into a flag.
What a high or low flag outside the range means
A high or low flag means a result sits outside that lab's reference range. Follow-up may be warranted, yet the flag alone does not show a condition is present. By design, some healthy people always land outside.
A clinician reads a flagged value alongside symptoms, history, and repeat tests. An in-range result is no guarantee of good health either, since disease can be present with in-range results.
A critical result, or panic value, is separate from an ordinary H or L flag. Labs keep their own alert lists and notify the clinician urgently, usually by phone. The same number can also be judged against ranges built for other purposes.
Get 100+ biomarkers tested in-lab or at home
One blood draw a year. A full picture of your health, explained in plain language.
Get 100+ biomarkers tested in-lab or at home
One blood draw a year. A full picture of your health, explained in plain language.
Reference range vs optimal range vs decision limit
A reference range shows where healthy people's results usually fall. An optimal range is a narrower target linked to lower risk, where research supports one. A decision limit is a guideline cutoff tied to a specific condition. Each answers a different question about the same number.
| Range type | How it is set | What it tells you | Example |
|---|---|---|---|
| Reference range | Middle 95% of results from healthy people | Where a result sits relative to a healthy population | The low and high limits printed on a lab report |
| Optimal range | Outcome research on risk within the reference range | Where lower risk may lie, for markers with evidence | Among young men, fasting glucose of 87 mg/dL or more, though under 100 mg/dL, carried higher type 2 diabetes risk than under 81 mg/dL |
| Decision limit | Guideline cutoff based on outcome risk | Whether a result meets a condition's threshold | Hemoglobin A1c: under 5.7% normal, 5.7% to 6.4% prediabetes, 6.5% or above diabetes; a second test usually confirms the result |
A result marked normal can still sit high within its range. Where a value lands inside the range, and how it moves over time, add context that a single flag leaves out.
Understand your lab results with Superpower
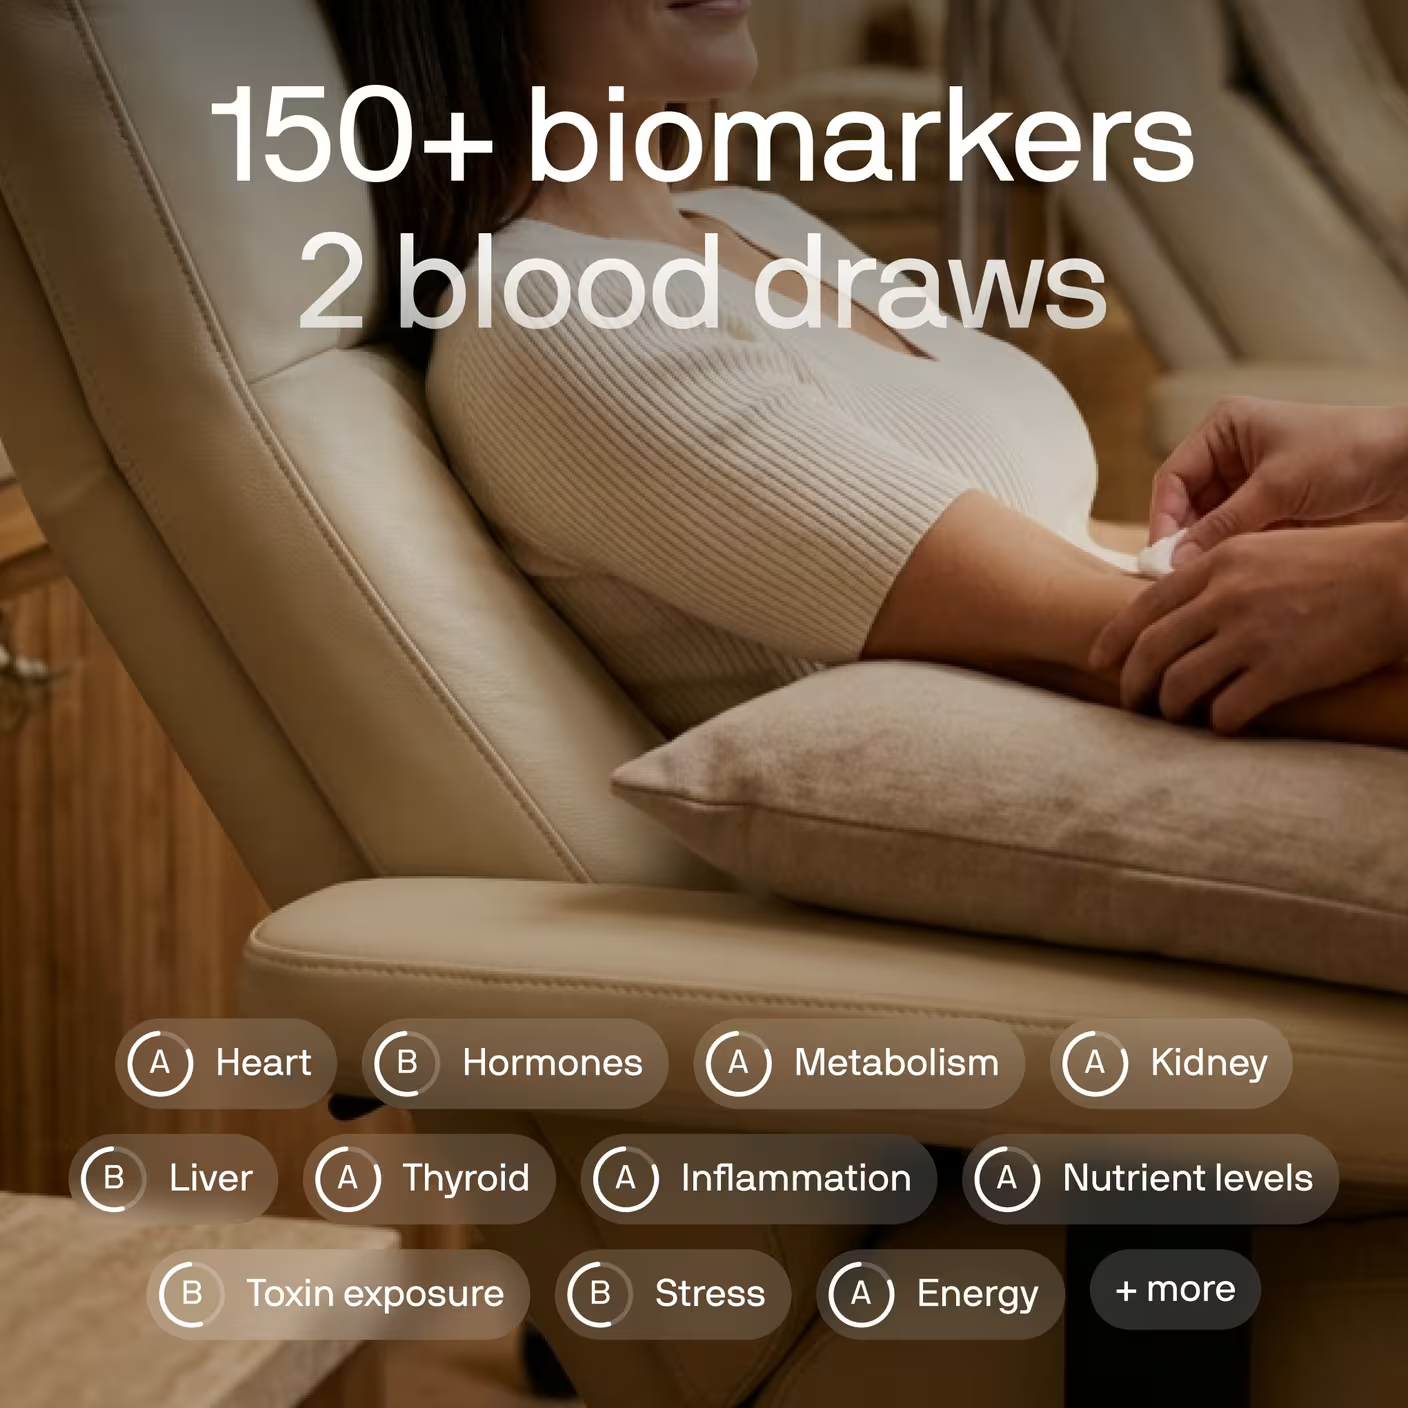
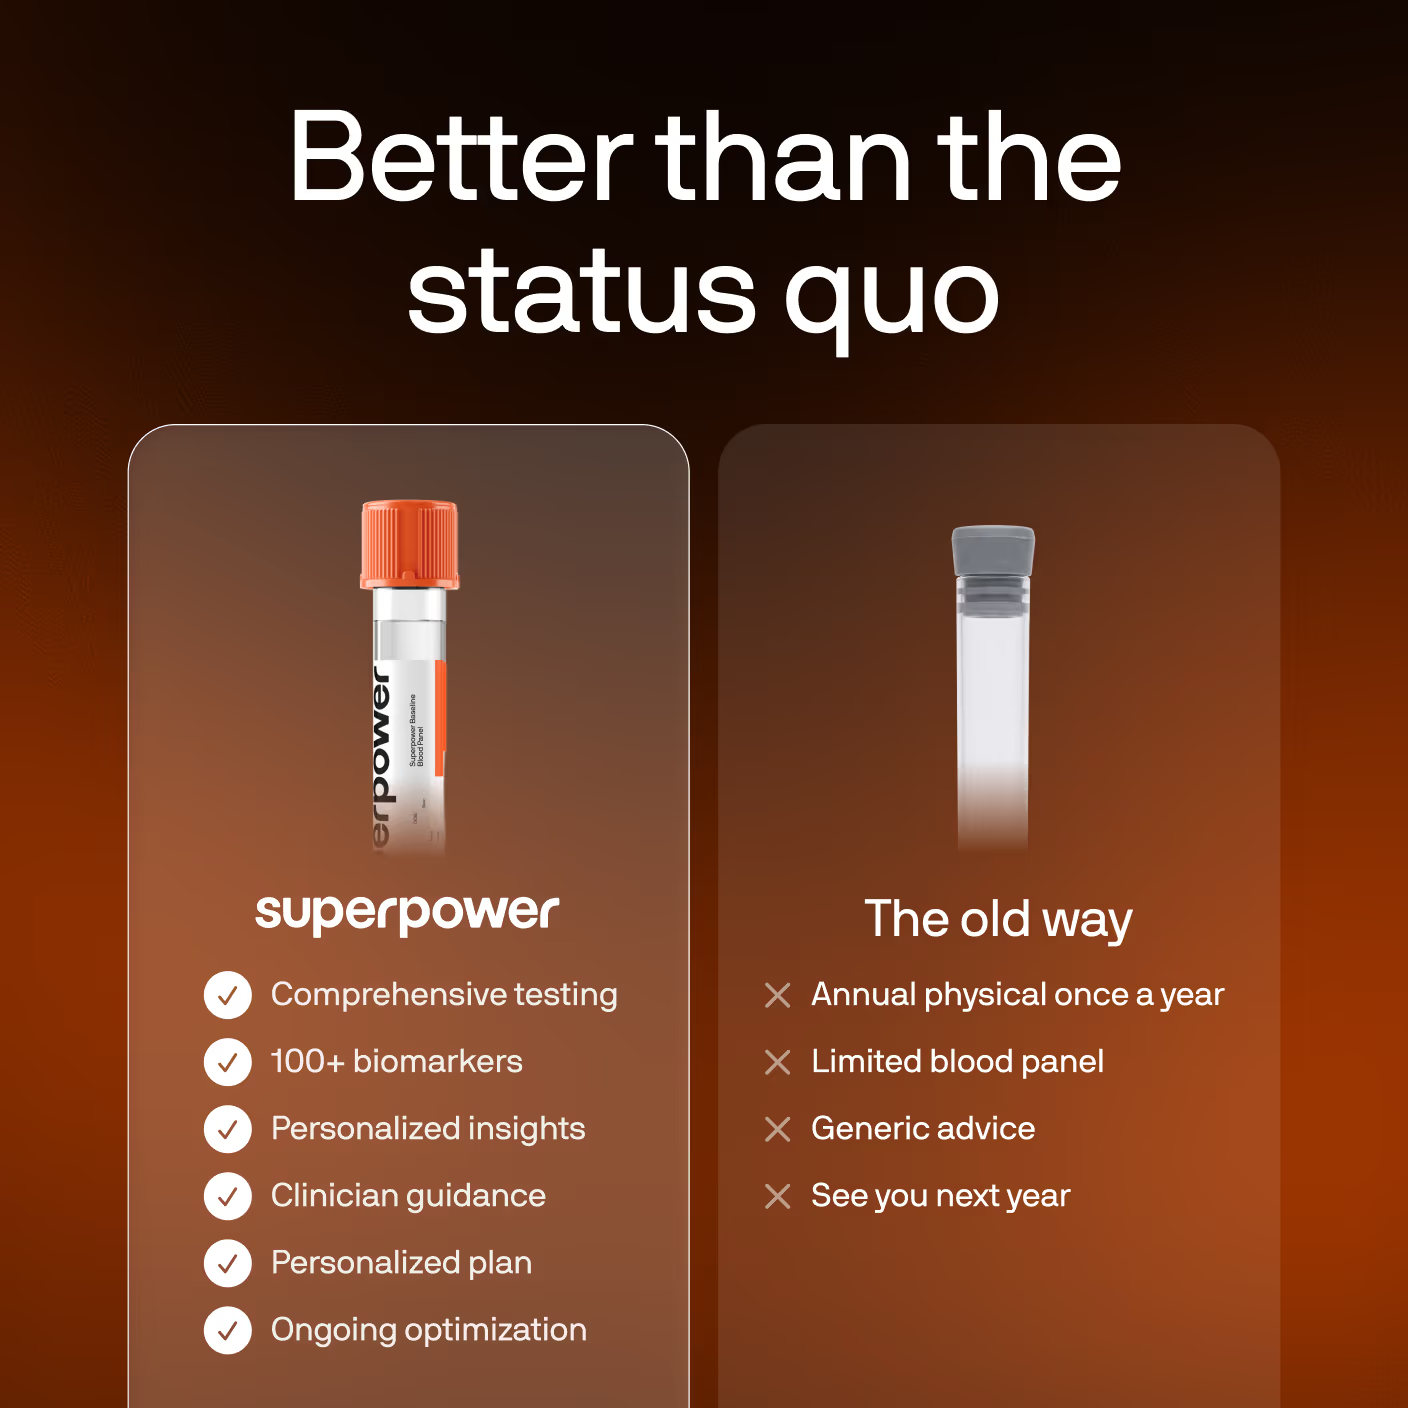
A reference range means the most when a comprehensive blood test puts your own numbers beside it. A Superpower membership includes 100+ biomarkers in a single draw, glucose and hemoglobin A1c among them. Superpower is your home for health, measuring those markers and supporting improvements with a personalized protocol, plus AI and care team support.
It's time to know your numbers. Start your Superpower membership and get your baseline in one draw.
References
- National Library of Medicine (2025). How to understand your lab results. *MedlinePlus Medical Test*. https://medlineplus.gov/lab-tests/how-to-understand-your-lab-results/
- Doles N, Ye Mon M, Shaikh A, et al (2025). Interpretating normal values and reference ranges for laboratory tests. *Journal of the American Board of Family Medicine*, *38*(1), 174–179. https://doi.org/10.3122/jabfm.2024.240224R1
- Timbrell NE (2024). The role and limitations of the reference interval within clinical chemistry and its reliability for disease detection. *British Journal of Biomedical Science*, *81*, 12339. https://doi.org/10.3389/bjbs.2024.12339
- van Schrojenstein Lantman M, van Berkel M, Kuijper P, et al (2024). Clinical decision-making suffers from inequivalent measurement results and inadequate reference intervals. *Clinical Chemistry*, *70*(11), 1383–1392. https://doi.org/10.1093/clinchem/hvae129
- Coşkun A, Sandberg S, Unsal I, et al (2023). Personalized and population-based reference intervals for 48 common clinical chemistry and hematology measurands: a comparative study. *Clinical Chemistry*, *69*(9), 1009–1030. https://doi.org/10.1093/clinchem/hvad113
- Shin S, Kim S, Yu S, et al (2026). Fasting duration and differences across routine laboratory tests. *JAMA Internal Medicine*. Published online September 28, 2026. https://doi.org/10.1001/jamainternmed.2026.4718
- Feriel J, Tchipeva D, Depasse F (2021). Effects of circadian variation, lifestyle and environment on hematological parameters: a narrative review. *International Journal of Laboratory Hematology*, *43*(5), 917–926. https://doi.org/10.1111/ijlh.13590
- Sanchis-Gomar F, Lippi G (2014). Physical activity - an important preanalytical variable. *Biochemia Medica*, *24*(1), 68–79. https://doi.org/10.11613/BM.2014.009
- Ozarda Y, Sikaris K, Streichert T, Macri J; IFCC Committee on Reference Intervals and Decision Limits (2018). Distinguishing reference intervals and clinical decision limits - a review by the IFCC Committee on Reference Intervals and Decision Limits. *Critical Reviews in Clinical Laboratory Sciences*, *55*(6), 420–431. https://doi.org/10.1080/10408363.2018.1482256
- Truijens K, Frans G, Vermeersch P (2024). Critical results in laboratory medicine. *Clinical Chemistry*, *70*(10), 1220–1230. https://doi.org/10.1093/clinchem/hvae120
- Tirosh A, Shai I, Tekes-Manova D, et al (2005). Normal fasting plasma glucose levels and type 2 diabetes in young men. *New England Journal of Medicine*, *353*(14), 1454–1462. https://doi.org/10.1056/NEJMoa050080
- National Institute of Diabetes and Digestive and Kidney Diseases (2018). The A1C test & diabetes. *NIDDK*. https://www.niddk.nih.gov/health-information/diagnostic-tests/a1c-test
























 Heart & Vascular Health
 Metabolic Health
 Energy
 Liver Health
 Kidney
 Sex Hormones
 Thyroid Health
 Nutrients
 Immune System
 Inflammation