Excellent 4.6 out of 5
Metabolic and Nutritional Disorders

Insulin Resistance

Insulin resistance quietly disrupts how your body uses energy, raising cardiometabolic risk. Biomarker testing detects this early. At Superpower, we measure Insulin, Glucose, and the TyG Index (triglyceride–glucose) to assess insulin sensitivity and metabolic stress in liver and adipose tissue.

With Superpower, you have access to a comprehensive range of biomarker tests.

Test for Insulin Resistance
Cancel anytime
HSA/FSA eligible
Results in a week
Physician reviewed

Every result is checked

·
CLIA-certified labs

Federal standard for testing

·
HIPAA compliant

Your data is 100% secure

Key Benefits

  • Check how well your body responds to insulin.
  • Spot early insulin resistance before standard blood sugar tests become abnormal.
  • Flag higher risk for type 2 diabetes and metabolic health problems.
  • Clarify fatigue, cravings, or stubborn weight gain linked to insulin imbalance.
  • Guide nutrition, activity, sleep, and medication choices to improve insulin sensitivity.
  • Protect heart and liver health by flagging heart disease and fatty liver risk.
  • Support fertility and PCOS care by identifying insulin-driven hormone disruption.
  • Track progress from lifestyle or therapy changes with repeat fasting measurements.

What are Insulin Resistance

Insulin resistance biomarkers reveal how well insulin’s message is getting through to muscle, liver, and fat cells, and how hard the pancreas must work to keep blood sugar steady. They translate the body’s fuel traffic into signals you can track: immediate insulin–glucose balance (fasting insulin, C‑peptide, glucose), longer-term sugar exposure (glycated hemoglobin, HbA1c), how fats are handled (triglycerides, HDL cholesterol), liver strain linked to sugar and fat overload (ALT, GGT), and the metabolic “background noise” of inflammation and adipose hormones (high‑sensitivity C‑reactive protein, adiponectin, leptin). Together, these markers reflect tissue sensitivity to insulin (insulin action), pancreatic workload (beta‑cell stress), liver glucose production (hepatic output), and fat release from adipose tissue (lipolysis). Testing them helps spot metabolic friction years before overt high blood sugar, clarifies where resistance is most active, and shows whether lifestyle or treatments are restoring insulin’s effect. In short, insulin resistance biomarkers provide an early, systems-level view of energy regulation, enabling timely action to protect metabolic health and lower the future risk of conditions like type 2 diabetes, fatty liver, and cardiovascular disease.

Why are Insulin Resistance biomarkers important?

Insulin resistance biomarkers show how efficiently your body turns food into usable energy. They capture the conversation among pancreas, liver, muscle, fat, and blood vessels—how insulin moves glucose into cells, how the liver releases sugar, how fat is handled, and how the brain is fueled.

In practice, fasting glucose, fasting insulin, and composite indices (like TyG and HOMA-IR) are interpreted together. Fasting glucose typically spans about 70–99, with lower‑normal values often reflecting better sensitivity. Fasting insulin commonly falls near 2–10, where single‑digit values tend to be favorable. TyG is unitless; in many cohorts it sits in the 8s, with lower values generally better and risk rising toward the high‑8s to 9s (cutoffs vary by study).

When these markers are low—glucose and insulin in the lower‑normal range—they signal efficient insulin signaling and flexible metabolism. If glucose dips too low, shakiness, sweating, and confusion can occur; this is more likely in children, after prolonged fasting, or when glucose‑lowering medications are present. Trained athletes often run low without symptoms.

When fasting insulin, glucose, or TyG drift high, it points to hepatic and adipose insulin resistance: the liver overreleases glucose, fat tissue leaks fatty acids, and triglycerides climb. People may notice fatigue after meals, brain fog, increased waist circumference, or skin tags. Puberty and pregnancy naturally raise insulin needs; women with PCOS and men with more visceral fat often show higher values.

Big picture: these biomarkers connect metabolism to cardiovascular risk, fatty liver, kidney strain, and cognition. Tracked with triglycerides, HDL, A1c, ALT, and C‑peptide, they reveal early shifts years before diabetes, sharpening risk assessment and long‑term planning.

What Insights Will I Get?

Insulin resistance sits at the crossroads of energy flow, metabolic flexibility, and vascular health. When cells respond poorly to insulin, glucose handling, lipid traffic, and inflammation all shift, influencing cardiovascular risk, cognition, fertility, and immune tone. At Superpower, we test Insulin, Glucose, and the TyG Index to map this system.

Insulin is the hormone that helps move glucose into cells; higher fasting insulin often signals compensatory output to overcome cellular resistance (hyperinsulinemia). Glucose is the circulating fuel; fasting glucose typically rises later, when resistance and beta‑cell stress are more advanced (impaired fasting glucose). The TyG Index combines fasting triglycerides and glucose; it is a validated surrogate of insulin resistance, particularly in the liver, and reflects lipid–glucose coupling and ectopic fat burden.

Insulin: Lower, stable fasting insulin suggests efficient signaling; elevated levels with normal glucose indicate early compensation; persistent elevation with rising glucose indicates diminishing beta‑cell reserve. Glucose: Stable, normal fasting glucose indicates effective glycemic control; upward drift signals impaired regulation and higher cardiometabolic strain. TyG Index: Lower values indicate flexible fuel handling and favorable hepatic insulin action; higher values indicate reduced metabolic flexibility, hepatic insulin resistance, and a more atherogenic milieu.

Notes: Interpretation is influenced by fasting status, acute illness or stress, pregnancy, age/puberty or menopause, sleep loss, and recent strenuous exercise. Medications (e.g., glucocorticoids, beta‑blockers, thiazides, statins), liver steatosis, and assay variability also affect results. Single measurements can fluctuate; context improves accuracy.

Superpower also tests for

See more diseases

Frequently Asked Questions About Insulin Resistance

What is Insulin Resistance testing?

It evaluates how well your cells respond to insulin and keep blood sugar in check. Superpower measures fasting Insulin and Glucose and reports the TyG Index (a triglyceride–glucose composite). Together, these show pancreatic insulin output, glucose control, and liver-driven metabolic stress. Higher insulin at a given glucose suggests reduced insulin sensitivity. A higher TyG Index points to hepatic insulin resistance and lipid–glucose overload. This is a systems view of early metabolic dysfunction, often before glucose alone becomes abnormal.

Why should I get Insulin Resistance biomarker testing?

Insulin resistance develops silently and drives metabolic strain years before diabetes. Testing reveals how hard your pancreas is working, how stable your glucose is, and whether the liver is insulin resistant. Elevated insulin or TyG Index links to higher risk of type 2 diabetes, fatty liver disease, atherosclerosis, and hypertension. Early detection lets you track metabolic load, quantify improvement or deterioration, and prevent organ-level complications.

How often should I test?

Start with a baseline. If you have risk factors or prior abnormalities, recheck every 3–6 months to confirm trajectory. When stable and in a healthy range, annual testing is reasonable. Test sooner after major weight change, medication changes that affect glucose or lipids, acute illness recovery, pregnancy/postpartum, or if prior results were borderline. Trends over time are more informative than a single value.

What can affect biomarker levels?

Recent food or alcohol intake, dehydration, poor sleep, acute stress, infections, and intense exercise can shift insulin, glucose, and TyG. Menstrual cycle phases and pregnancy alter insulin sensitivity. Medications such as steroids, beta-agonists, thiazides, atypical antipsychotics, niacin, and high-dose statins can raise glucose or triglycerides; insulin and secretagogues lower glucose while changing insulin dynamics. Time of day and lab variability also matter. Fasting status is critical for meaningful comparison.

Are there any preparations needed before Insulin Resistance biomarker testing?

Fast 8–12 hours; water only. Schedule a morning draw. Avoid alcohol and heavy exercise for 24 hours, and aim for a normal dinner and regular sleep the night before. Stay well hydrated. Take prescribed medications as directed unless specifically told otherwise, noting that some drugs affect glucose, insulin, or triglycerides. High-dose biotin supplements can interfere with certain immunoassays; pausing before testing may be necessary per product guidance.

Can lifestyle changes affect my biomarker levels?

Yes. Weight loss, higher physical activity, improved diet quality, regular sleep, and lower stress generally lower fasting insulin and the TyG Index by improving insulin sensitivity and hepatic fat handling. Weight gain, sedentary time, sleep loss, high alcohol intake, and ultra-processed, high-sugar diets tend to raise them. Changes can appear within weeks, with larger, more durable shifts over months as tissues regain insulin responsiveness.

How do I interpret my results?

Low-normal fasting insulin with normal glucose and a low TyG Index indicates good insulin sensitivity and low hepatic metabolic stress. Normal glucose with high insulin and/or a high TyG Index suggests compensated insulin resistance—risk is rising even if glucose is “normal.” Elevated glucose with high insulin reflects overt resistance; elevated glucose with low insulin may indicate beta-cell insufficiency. Rising trends across tests matter more than isolated values.

How it works

1

Test your whole body

Get a comprehensive blood draw at one of our 3,000+ partner labs or from the comfort of your own home.

2

An Actionable Plan

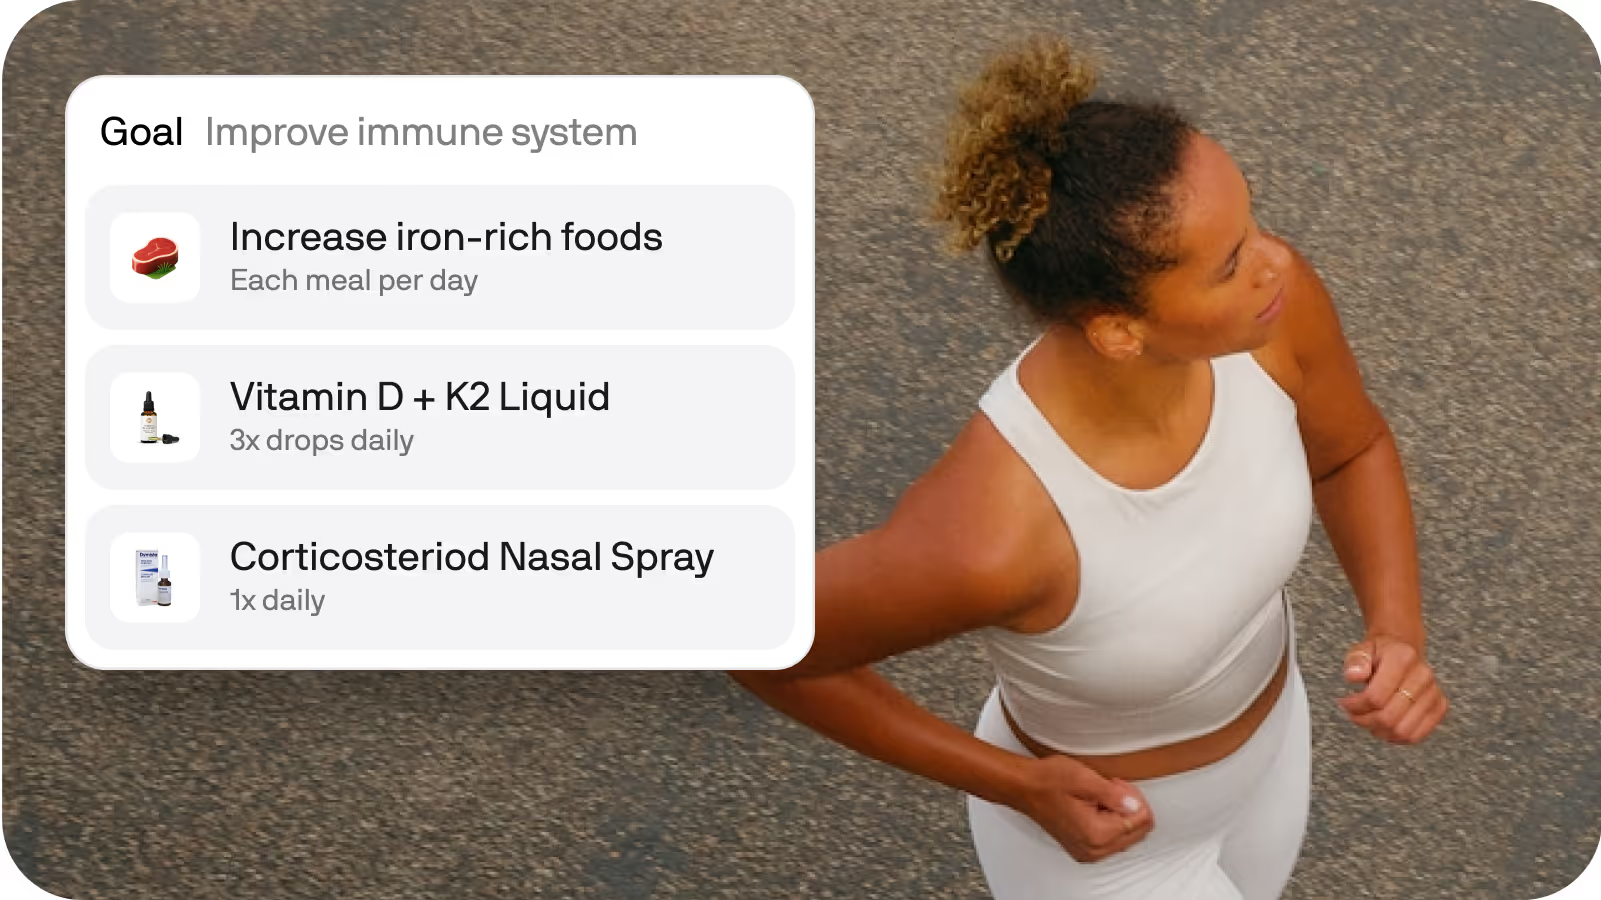
Easy to understand results & a clear action plan with tailored recommendations on diet, lifestyle changes, supplements and pharmaceuticals.

3

A Connected Ecosystem

You can book additional diagnostics, buy curated supplements for 20% off & pharmaceuticals within your Superpower dashboard.

Superpower tests more than 
100+ biomarkers & common symptoms

Developed by world-class medical professionals

Supported by the world’s top longevity clinicians and MDs.

Dr Anant Vinjamoori

Superpower Chief Longevity Officer, Harvard MD & MBA

A smiling woman wearing a white coat and stethoscope poses for a portrait.

Dr Leigh Erin Connealy

Clinician & Founder of The Centre for New Medicine

Man in a black medical scrub top smiling at the camera.

Dr Abe Malkin

Founder & Medical Director of Concierge MD

Dr Robert Lufkin

UCLA Medical Professor, NYT Bestselling Author

membership

$17

/month
Billed annually at $199
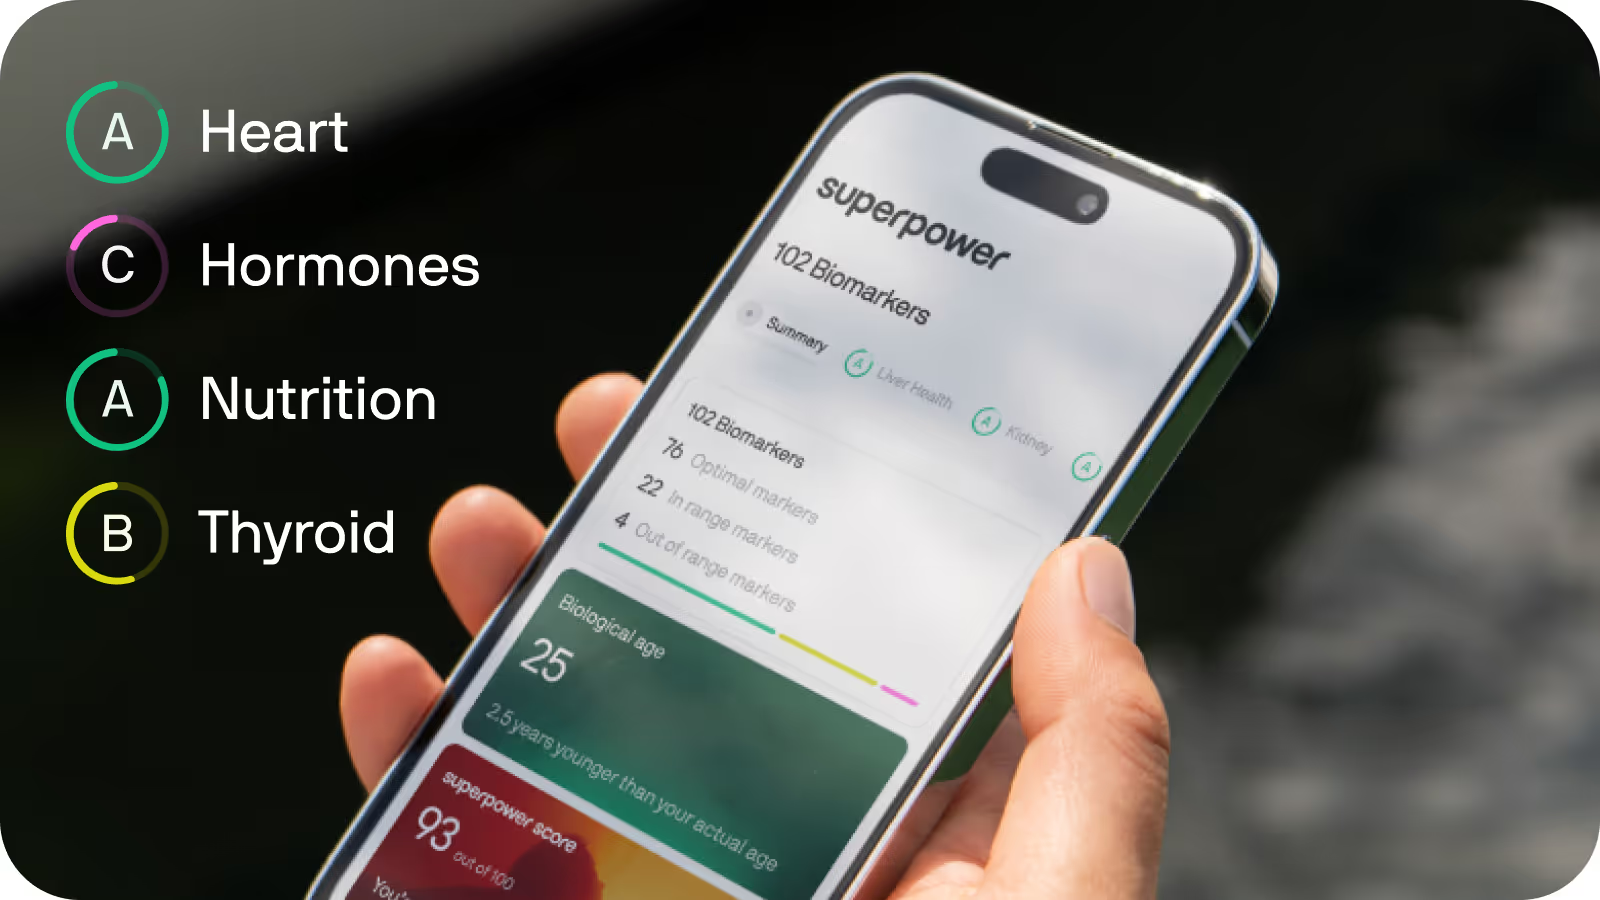
A smartphone displays health app results, showing biomarker summary, superpower score, and biological age details.
A website displays a list of most ordered products including a ring, vitamin spray, and oil.
A smartphone displays health app results, showing biomarker summary, superpower score, and biological age details.A tablet screen shows a shopping website with three most ordered products: a ring, supplement, and skincare oil.
What could cost you $15,000 is $199

Superpower
Membership

Your membership includes one comprehensive blood draw each year, covering 100+ biomarkers in a single collection
One appointment, one draw for your annual panel.
100+ labs tested per year
A personalized plan that evolves with you
Get your biological age and track your health over a lifetime
$
17
/month
billed annually
Flexible payment options
Four credit card logos: HSA/FSA Eligible, American Express, Visa, and Mastercard.
Start testing
Cancel anytime
HSA/FSA eligible
Results in a week
Pricing may vary for members in New York and New Jersey **

Finally, healthcare that looks at the whole you